
January 2018 stats signal more sellers in the market
Last year, U.S. consumers seemed to be operating with a renewed but cautious optimism. The stock market was strong, wages were edging upwards and home buying activity was extremely competitive. Not much has changed in 2018 in terms of those measures, yet there is a sort of seasoned prudence mixed into the high emotions that go with a major expense like a home purchase.
We are now several years deep in a period of rising prices and decreasing inventory. Those in the market to buy a home have caught on. Having the financial ability to make a move clearly seems feasible to many buyers in our healthy economy, whether life events such as marriage, children, employment change or desirable downsizing is the reason for moving. A change in life events is what typically spurs a move during the winter months.
There are further positive signs on the horizon, as builder confidence has improved and construction job gains are measurably higher in Central Oklahoma.
More sellers should feel ready and willing to list in 2018. Economic indicators such as unemployment rates and consumer confidence are improving, and sellers currently have the upper hand in the buyer-seller relationship. This doesn’t mean they can just set a blue-sky price and watch the offers roll in. Savvy buyers will be poised to test prevailing price points and expected continued mortgage rate increases this year.
Here is a snapshot of the Shawnee market update for January, 2018.
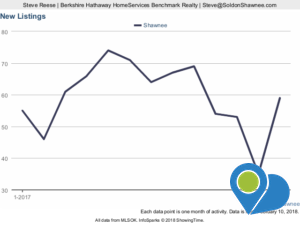 Compared to January 2017, the number of closed sales was up 14.7% to 39; that’s up three from December. New listings of single family homes in Shawnee was 56. That’s only one more than last January, but a whopping 64.7% more than we saw in December 2017. Pending sales—houses for sale that received acceptable purchase contracts—are up from 34 to 39, or 14.7%, and inventory of available listings increased 21.2% from 151 to 183 from last year.
The average sales price for single family homes in Shawnee dipped a slight 1.6% to $154,372 from January 2017. But that’s almost 30% higher than December 2017’s average of $118,942. Shawnee’s days on market inched up seven days, or 11.7% to an average of 67 days for single family homes, up from 81 days in December 2017. The months supply of inventory in Shawnee increased 16.7% to 4.2 months over last year, virtually unchanged from December.
What I’m reading about external forces placed upon residential real estate markets across the country—whether related to tax legislation, mortgage rates, employment situation changes, new family formations, the availability of new construction and the like—the appetite for home buying remains strong enough to drive prices upward in virtually all markets across the country. I predict monthly increases until at least late summer.
As always, Shawnee offers an incredible value for home prices and cost of living compared to rest of the Oklahoma City metro area. I keep a close eye on our local market trends so I can answer the questions people. For a historical visualization of Shawnee housing market trends, visit the Shawnee Market Stats page of SoldonShawnee.com.
If you would to discuss your particular property and how recent sales affect your home’s value, just call/text me at (405) 585-6580 or email Steve@SoldonShawnee.com. The data used in this blog post is from a research tool provided by MLSOK.